SCOM Dashboards - The Intro
SCOM Dashboards - Part 1 - Installing WSS 3.0
SCOM Dashboards - Part 2 - Installing the Dashboard Solution Accelerator
SCOM Dashboards - Part 3 - Customizing the Dashboard Banner and Logo
SCOM Dashboards - Part 4 - Customizing the Dashboard Tabs
SCOM Dashboards - Part 5 - Installing the Service Level Dashboard (SLD 2.0)
SCOM Dashboards - Part 6 - Adding SQL Queries to the Dashboards
SCOM Dashboards - Part 7 - The SCOM Distributed Application Health State Tab
The final piece of this jigsaw is to add the Service Level Dashboard Web Page as an active tab alongside the SCOM Dashboard and SCOM Distributed Applications Health State tabs
Open the SCOM Dashboard home page and click on 'Site Actions' on the left hand side, then select 'Site Settings' from the drop down menu

Now click on the 'Top Link Bar' link


Now copy the URL for the Service Level Dashboard web page into the field as shown and then click 'OK'

You now have an additional tab for your 'SCOM Service Level Dashboard' and when you click on the tab, it opens up your SLD page

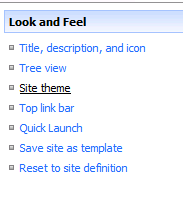
When you open your SLD page, click on the 'Site Settings' option to add the SCOM Dashboard tabs to this webpage

Again, in the 'Look and Feel' section, click on the 'Top Link Bar' to make the customisations. When you see the screen below, click on the icon beside 'Home' to edit the name of the Home tab.
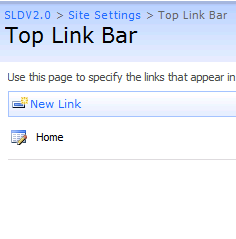
Change the name of the 'Home' tab to something like 'SCOM Service Level Dashboard' as shown below, then click 'OK'

Now click on the 'New Link' button from the 'Top Link Bar' to create the other tabs for the SCOM dashboard

From the window below, copy the URL for your previously created 'SCOM Admin Dashboard' and type 'SCOM Admin Dashboard' into the description field as below, then click 'OK'

Now for the final time, click on the 'New Link' button again from the window below


Click on the 'Change Order' button to move the order of the tabs around to reflect the same order that you have from within your SCOM Admin Dashboard to provide a seamless integration look to both dashboards. Once you are happy with the order of the tabs, click 'OK' to complete the tab editing

Now all that's left to do is to change the theme of the SCOM Service Level Dashboard to look similar to the other SCOM dashboards. We do this by clicking on 'Site Actions' on the right hand side and then selecting 'Site Settings' again. When this opens, click on 'Site Theme' from within the 'Look and Feel' column

Your final SCOM Service Level Dashboard with associated SCOM dashboard tabs should now look like this

This completes your configuration of the SCOM dashboard solution that incorporates a SCOM Admin Dashboard, SCOM Distributed Application Dashboard and a SCOM Service Level Dashboard as three separate tabs within one web browser view.
The final post of this series will summarise what we have achieved so far, will provide web links to sites that I have found very useful when working with dashboards in SCOM and will provide some of the SQL queries that I have used to create these web parts.
No comments:
Post a Comment